Data Viewers

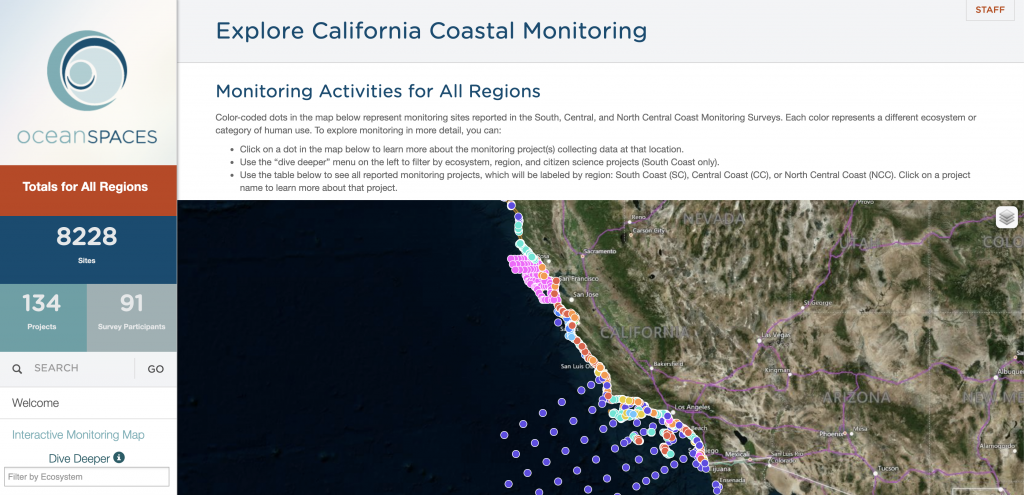
MPA Monitoring Dashboard


Use this interactive dashboard to explore who’s monitoring what, where along the California coast from Point Arena to the US-Mexico border. Data in the dashboard come from the results of the North Central, Central, and South Coast Monitoring Surveys. California Ocean Science Trust and its partners at the California Department of Fish and Wildlife and the California Ocean Protection Council are using the survey results to inform statewide MPA monitoring.

Click here to view the monitoring dashboard. 

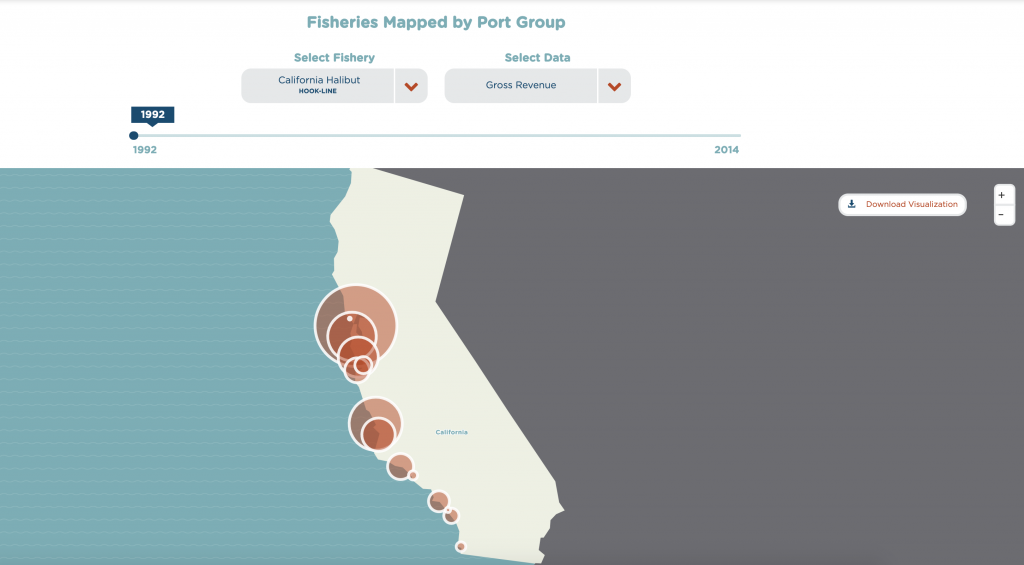
Fisheries Data Explorer


This interactive Fisheries Data Explorer allows you to visualize data from commercial fisheries and commercial passenger fishing vessels, across the State. Using data collected and managed by the California Department of Fish and Wildlife (CDFW), the Explorer lets you dynamically view summarized data from the commercial fishing sector (i.e., number of fishermen, pounds of fish landed, and revenue from fish landed) and from the commercial passenger fishing sector (i.e., the number of anglers, vessels, trips, and fish caught from specific fisheries and ports).

Funded by the California Ocean Protection Council, and developed in partnership with CDFW and the California Ocean Science Trust, the Explorer was developed through the California’s Marine Protected Area Monitoring Program, to ensure that the State’s decision-makers, stakeholders, and the public have ready access to data and information that support the health and management of California’s ocean.

Click here to use the Fisheries Data Explorer. 

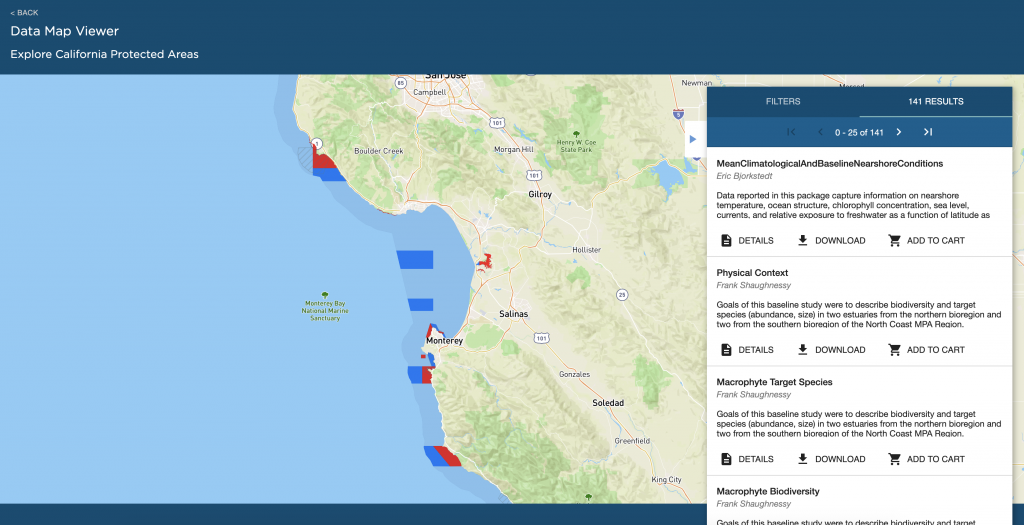
MPA Data Explorer


Explore data collected from protected areas in California. Search the map by ecosystem, keyword, or timeframe of data collected. The map shows state and federal protected areas along the California coast, including islands.


Click here to view the interactive map.

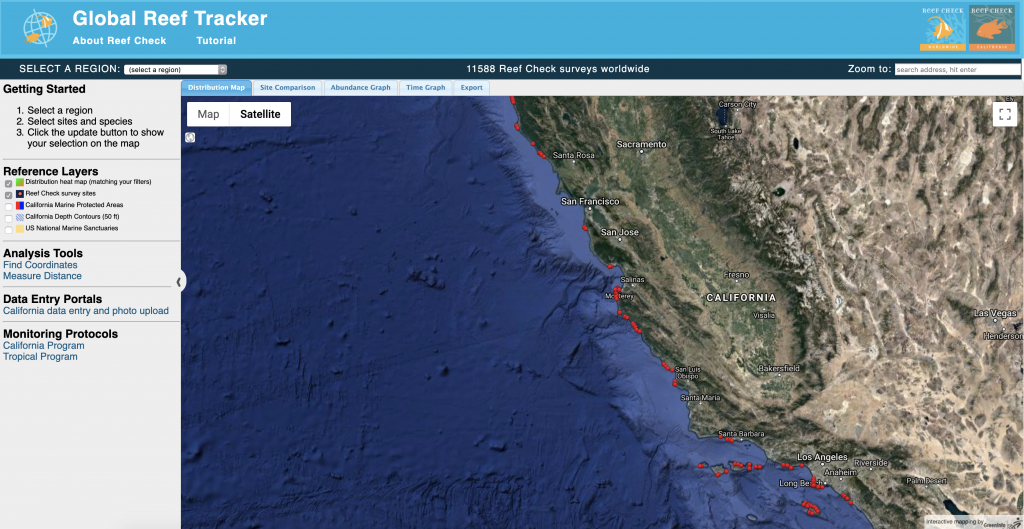
Reef Check Data Viewer


Reef Check’s data viewer is an interactive map that allows you to explore results of Reef Check surveys in California. Search by region, site or species.

Click here for the data viewer. 

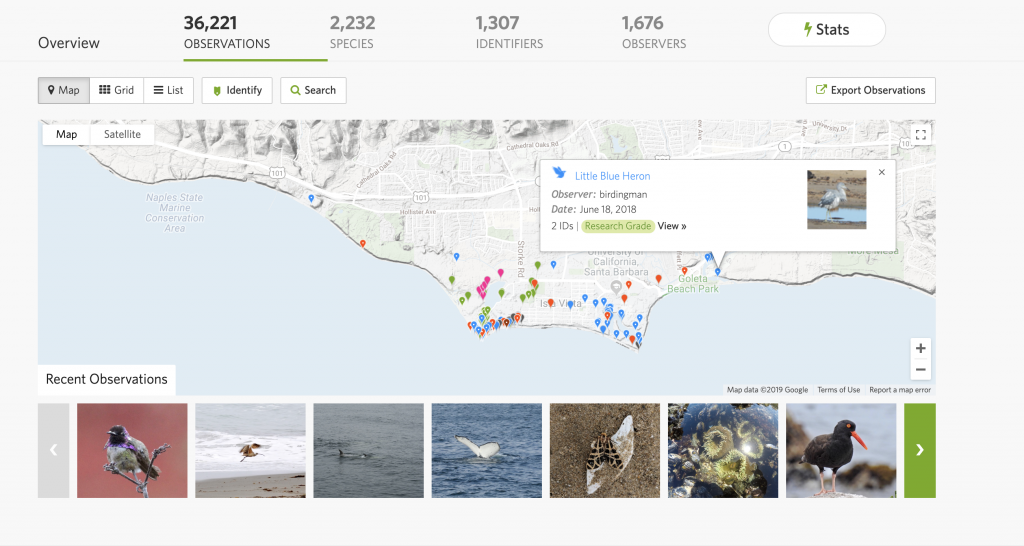
Snapshot Cal Coast Observation Viewer

Every year since 2016 the California Academy of Sciences organizes Snapshot Cal Coast-a statewide effort to document coastal species in California.

View the data collected here!

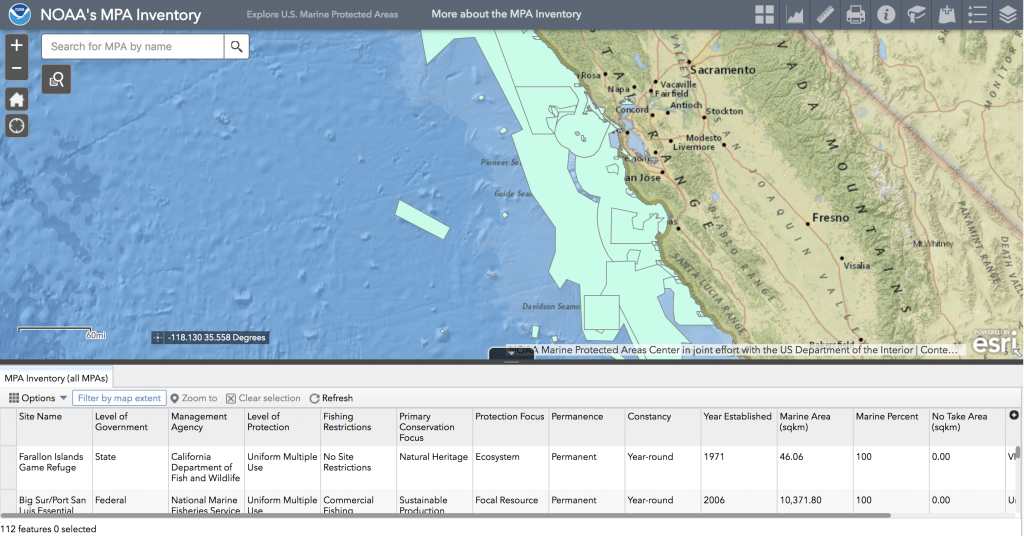
NOAA MPA Inventory & Data Viewer

NOAA’s Marine Protected Areas Inventory (MPA Inventory) describes all MPAs in US waters, where they are and what they do. This comprehensive geospatial database combines publicly available data with information from state and federal MPA programs. It can be used to view MPAs, explore status and trends of MPAs, create customized maps and analytical products, or add MPAs to data portals, online viewers and other spatial data visualizations.

Click here for the MPA Inventory Viewer. This application can be used to view, query and explore the MPA Inventory, a database compiled by NOAA’s Marine Protected Areas Center that catalogs information on over 1600 marine protected areas in U.S. waters.

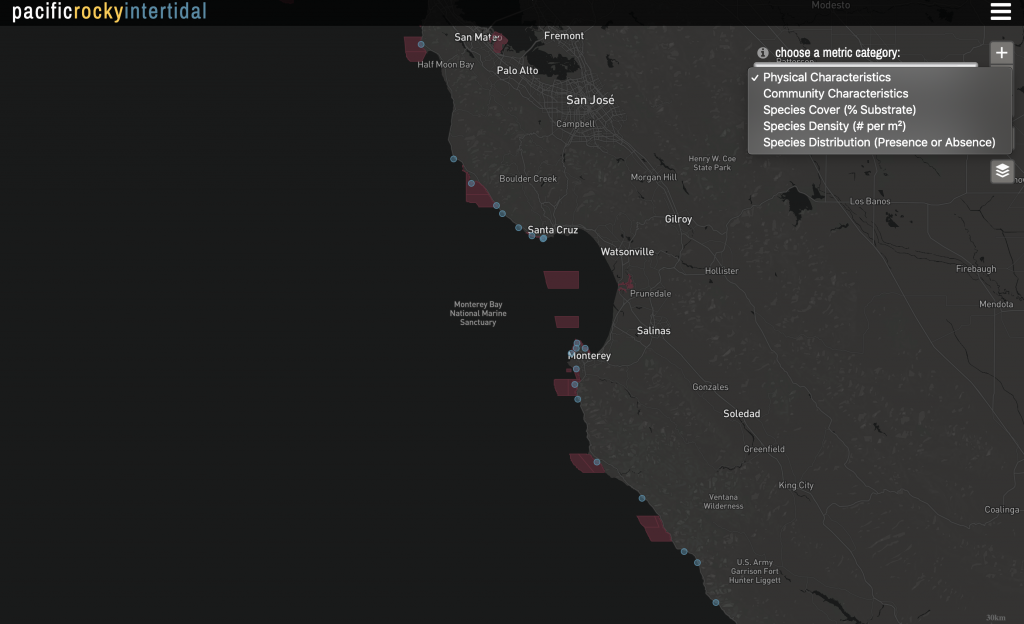
Multi-Agency Rocky Intertidal Network  (MARINe)

  • GIS Interactive Map and Data Display—Designed to display physical and community characteristics, species percent cover and density, and species distribution across 200 rocky intertidal monitoring sites in California.
  • Sea Star Wasting Syndrome tracking map— Displays observations of sick and healthy sea stars by species across all sites surveyed by researchers, citizen science groups, and the general public.
The mission of the California’s Marine Protected Areas Education and Outreach Initiative is to enhance MPA education through enduring partnerships to empower Californians to protect what they know and love.